BFTB-WX (Bolt From The Blue Weather)
The program is very easy to use, but this part will give you some ideas and hints on how to use BFTB-Wx in forecasting, as well as giving an overview on how to use it. You may also find this guide useful in understanding how to forecast storms with Skew-Ts and this program. Loading Soundings Pressing "F3" or going to the menu bar, selecting "Soundings" and then "Load" will bring up the below box:
Next, select the locality you want to take the sounding from, then select the date. The program defaults to the current date. Once you have selected both of these, select "load" and it will plot the sounding for you!
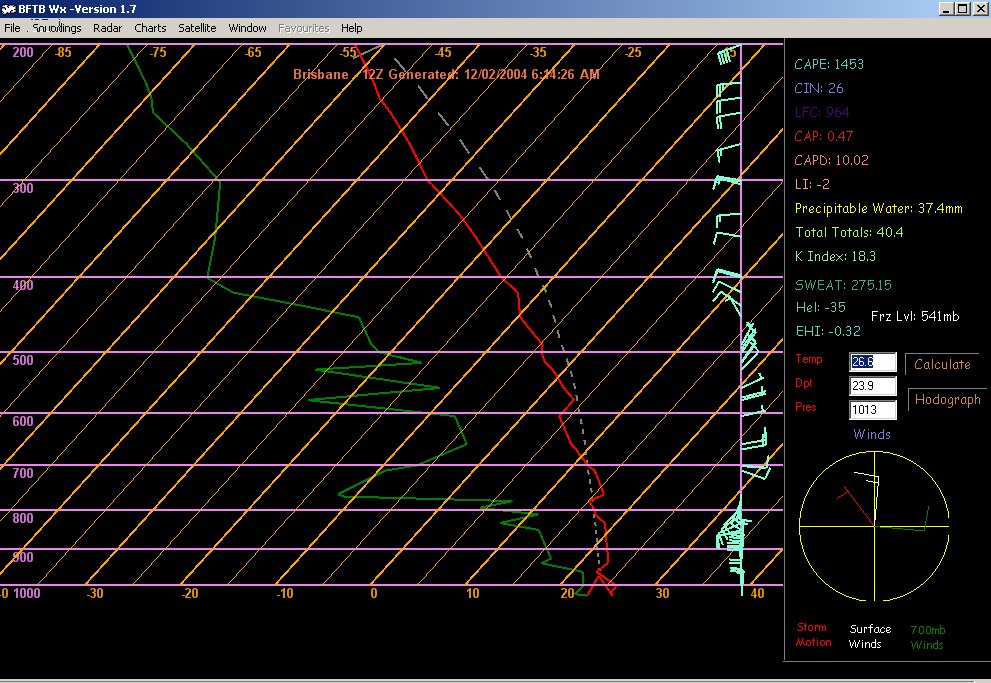
Modifying Soundings To modify the surface observations, there are 3 white boxes on the right. Simply change the temperature and dewpoint and press "calculate." If the pressure is going to change, then you would do well to change that also. The advantage of having a pressure value though is that you can also plot for elevated regions (just lower the pressure accordingly!) I modified the above sounding and have placed it below:
HINTS ON PLOTTING DP When you plot the DP, plotting the surface DP will give you the MAXIMUM potential. Since this potential is rarely achieved, a better representation could be given by averaging out the DP in the low levels (say lower 100mb). However, if it is very hot and the diurnal layer is deeper (1.5, 2km or more), then it could be advantageous to plot the average of that entire diurnal layer, as the upper part of the diurnal layer often mixes down! For more information on soundings, check my storm guide. Below are some examples:
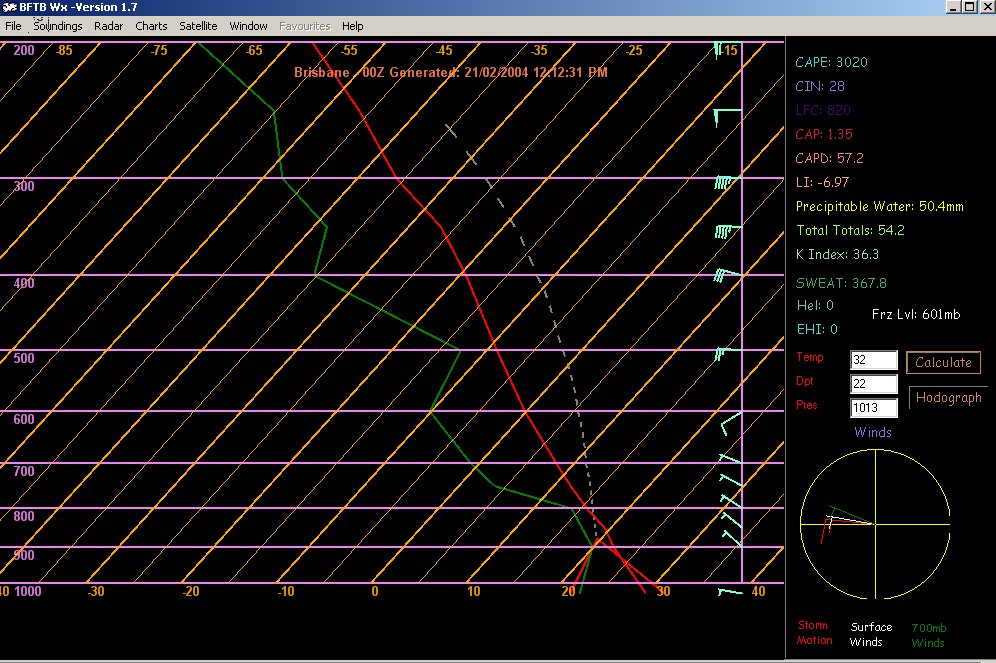
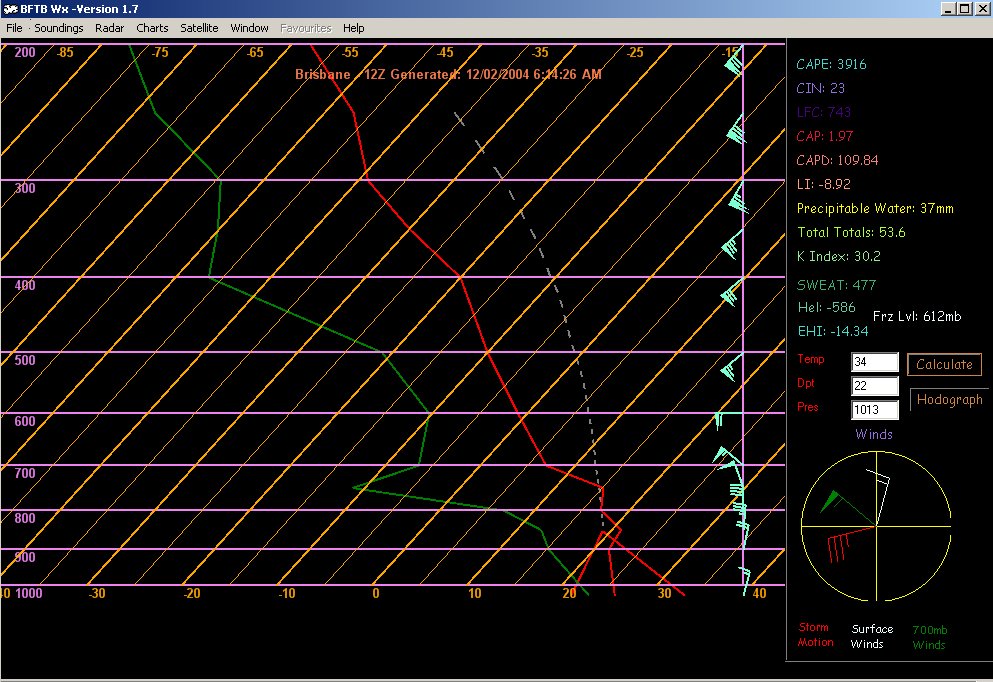
The above sounding is very moist in the low levels, the surface DP is 23 and it doesn't dry out much above that, so the average would be very close to the DP. So plotting with a DP of 22 or 23 would give a fairly accurate representation of the true potential.
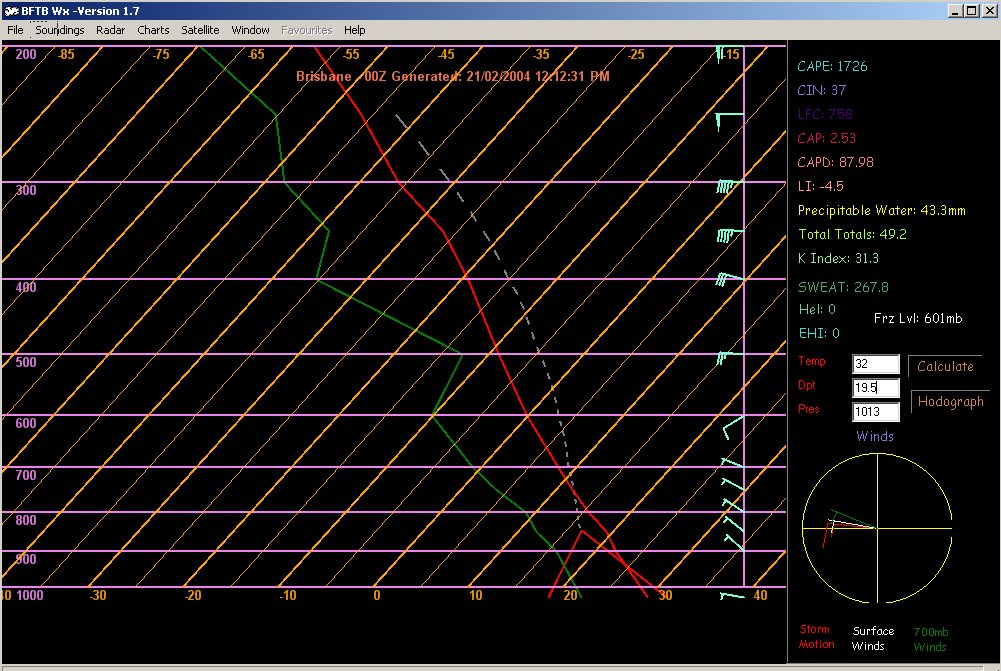
The above sounding is very moist near the surface, but dries out slightly in the lower levels. This is quite normal though, and plotting with a DP of 19-20 would give a fairly accurate representation of the true potential instability.
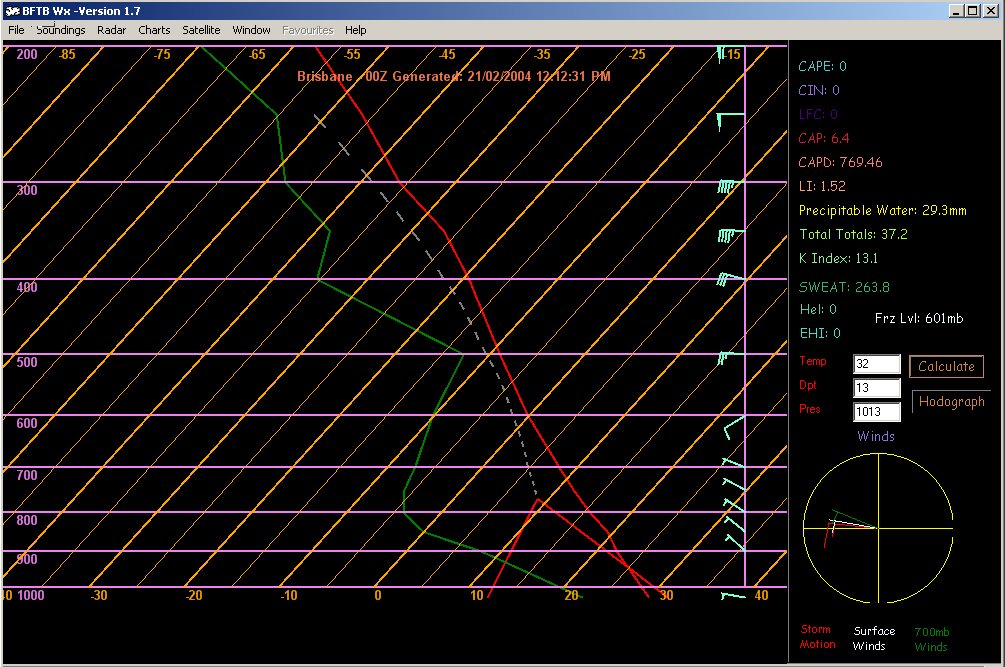
The above sounding is very moist at the surface, but dries out very rapidly in the low levels. The moisture is very shallow, so the moisture is likely to mix out. Hence plotting with a much lower DP (around 13 for this case), seems to give the best idea of potential.
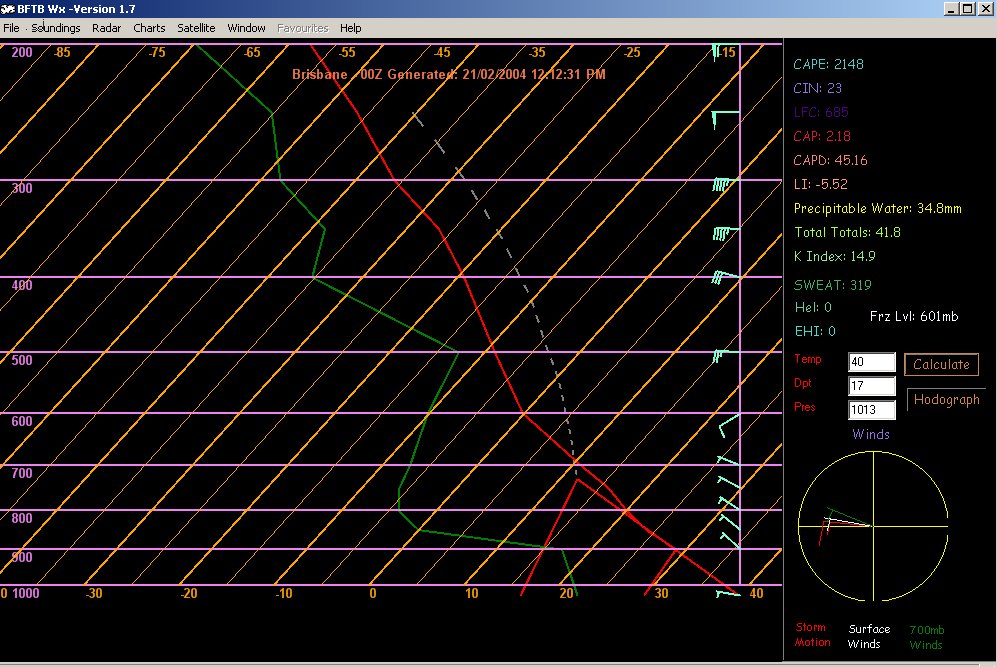
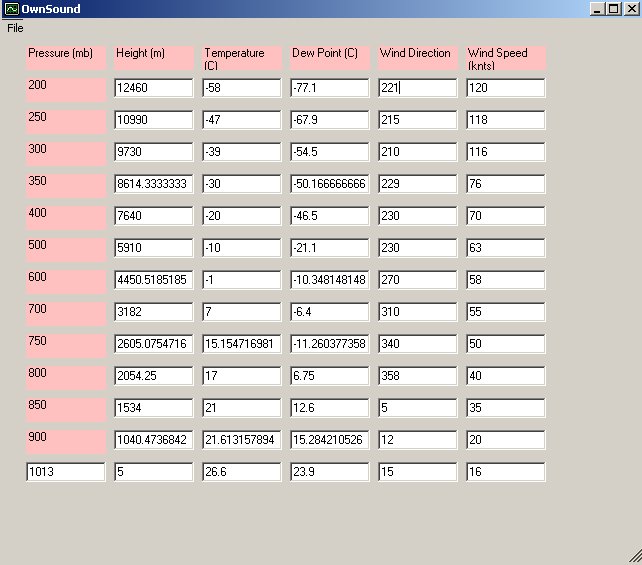
The above sounding is very moist in the low levels, however it is dry just above that. If the boundary layer was fairly shallow then this wouldn't be too bad, but because it will get very hot, this means that the bottom 2km will mix. So plotting to compensate for this gives a better idea of potential, hence choosing 17 to plot the sounding. Creating your own sounding Goto "Sounding" and then select "create/edit" or press F6 to bring up the below box. Simply add the numbers in:
Once you have modified, select "save and exit," this will bring you back to the main screen. Hit "calculate" to view your created sounding! You are once again free to change the surface temperature and DP for the entire sounding.
|