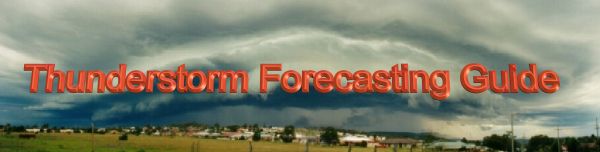
Shear - It's Not All the Same! Earlier in this guide I talked about the different shear strengths that can help organise our storms and give us what we want to see (whatever that may be! Often it's a well structured, and/or photogenic storm). But there are some other parts of shear that can come in handy. For instance, the way the winds are moving over a broad area can help enhance or suppress updrafts. They're often termed into two terms (convergence and divergence), but when people talk about these two they often mean confluence and diffluence. They're actually quite different - except for their overall meaning (ie winds coming together and moving away from each other). So what do I mean? Well, here are the definitions: (Excuse the diagram backgrounds, I made these in powerpoint for a presentation once and it was much easier to just copy them as images to view in html). Convergence: This is air that is slowing down to reach a point, so as you progress along the direction of the wind, the wind strength may go from 100 knots to 80 knots to 60 knots and so forth. This is analogous to traffic and say roadworks. Traffic will bank up at roadworks because people have to slow down - and people behind them moving at say 110km/h have to slow down to the roadworks limit (say 60km/h). As you can see, if you timed both points, more cars could move through the 110km/h zone then the 60km/h zone per hour. This causes cars to bank up - and eventually, cars begin to find other ways of getting around the area when the build up gets too big (ie take another road). This is the same with convergence, as the wind slows down it builds a small high pressure region - air then has to move away from this point, often moving up and down. So imagine an updraft underneath a convergent zone in the upper atmosphere, it's ascending along happily but then it approaches this point, and it begins to slow down because there is pressure being forced upon it from above. For example:
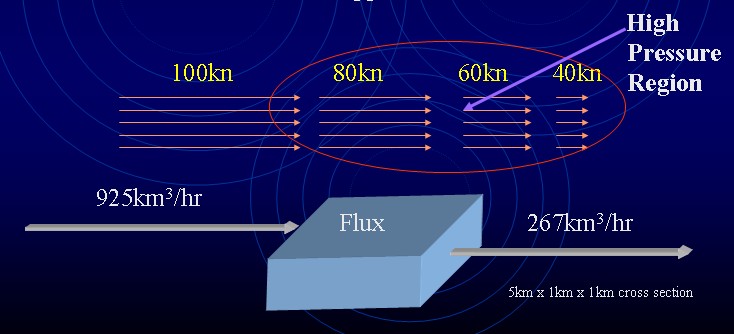
More air is entering the region then leaving - so this then pushes down on the updrafts. Convergence isn't all bad - for example, it's good in the low levels (surface-850mb, even 700mb sometimes). Keeping in mind that close to the surface, air here has no choice but to go upwards because air can't go below the ground surface! Confluence: Confluence means that the wind directions (streamlines) are coming in together and meeting up. This often occurs near troughs (at the surface), and is good because it allows the air to rise up into the atmosphere given it can't sink into the ground! Think of our traffic example from before, (the M1 comes into mind here, soon after the M6 interchange the M1 <stupidly!> goes from 8 lanes to 6 lanes). Often in the morning, going into the city this area banks up because where were lots of lanes, there are fewer lanes so cars begin to back up. Either all the cars have to be patient and just go through slower, or they need to start looking for alternative routes. Once again, if we have confluence in the upper atmosphere it will surpress updrafts because of the higher pressure region and general sinking air:
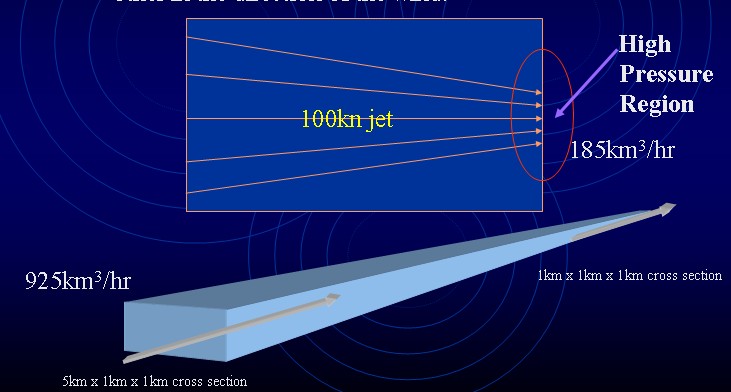
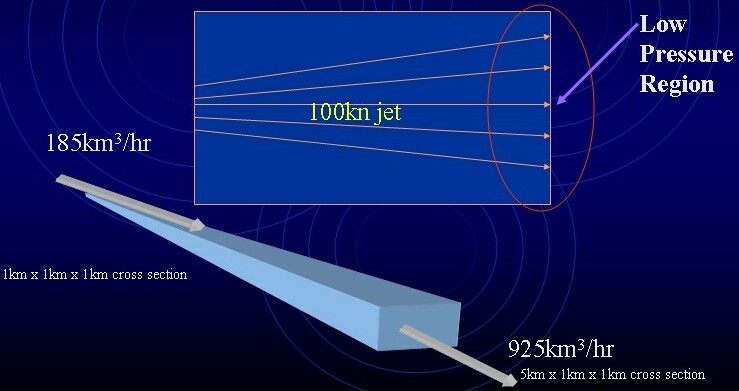
Ok - now lets look at the opposite... Divergence: The opposite of convergence, this is air speeding up in the direction of the winds. This could also be modeled from our cars coming out of the roadworks zone and now able to do 110km/h once again! You will see the cars become well separated from this area as cars are effectively able to leave faster than they arrive, hence the spacing. For instance:
Here air will be rising underneath the region and any updrafts in this will feel the effects of it and be able to rise even faster! This helps enhance the instability if its in the mid to upper levels (500mb and above), but it's not a good thing to see at the low levels. Diffluence: Once again the opposite to confluence, this is where the wind directions (streamlines) begin to spread out. Taking our M1 example, as you come out of the city in peak hour and you're slowly going along, then just prior to the M6 interchange you will enjoy some extra lanes and cars will be able to spread out and it will be effectively able to carry more traffic. In the case of the atmosphere, it will create a low pressure region because there's more air moving out of the region then entering the region, and once again will help enhance instability:
In my experience, I actually look out for confluence at the surface and diffluence in the mid to upper levels more than convergence and divergence, because I tend to find the former gives better results, but even I'm still learning about the effects of different shear setups on storm days! Lets look at some examples of what these things might look at if we saw them on charts:
Here's a 300mb analysis chart from the Millmeran Tornadic Supercell. Notice the diffluent jet to the west and south of Brisbane (YBBN)? Here the streamlines are spreading apart and that can help enhance the instability that updrafts will "feel." Here's some "proof:"
What's this chart? Well, I've overlayed the pressure vertical velocity over the streamlines at 300mb. In simple terms...it is a measure of how fast the air is rising. Remember, we have horizontal winds (north, south, east and west). Winds also move up and down!!! This is essentially what the upper level shear can help cause from divergence, diffluence, convergence and confluence - it can help create the vertical winds. Here, negative means that the air is ascending and positive values indicate descending air. Notice our nice cluster of rising air around the point where the diffluence starts? The maximum potential normally occurs where diffluence commences. Don't forget to have a look at the chase report from this day with photos of a small tornado from a very nice supercell! Here is another example from the December 30, 2001 Brisbane supercell. This is the surface and shows a defined line of confluence just to the west of Brisbane marking the trough line where air can rise and help break the cap:
Here NE winds are meeting W to NW winds along a trough line and helping to lift the air. Also note that air is converging on the trough line too? There reasonable winds of 10-15 knots at the surface, but it's slowing down at the trough line and that's also helping lift the air ahead of the trough line in the low levels. Lets look at the 300mb chart too, because it has "fake convergence" - and I want to emphasize something:
Nice jet right over SE QLD! Ok, look north of Brisbane (YBBN), see how the winds decrease as you push north? 70 knots to 40 knots across a relatively short distance. Don't get this confused, this is not convergence! Remember, the winds have to slow down in the direction of the wind - so remember that. There is however some convergence in the far SW of this plot where the wind speeds slow down in the direction of the wind. The key thing from this section is that vertical winds (partially derived from horizontal winds), can really help updrafts along, or alternative surpress them. Think of going out for a swim in the ocean. Ignoring any rips of sweeps - it can be quite hard to wade out into the ocean because the waves keep pushing you back. This is what our updrafts feel if the air is already sinking over its position. It has to work harder to get to the same area, and we don't want that! We want the journey for our updraft in the upper atmosphere to be an easy one. Similarly, if we're at the beach and already in the water, then it's much easier to wade or swim back to shore because the waves help push you back to land! Likewise, our updrafts find it much easier if the air around them is moving in the same direction they are! |